MONI PacketWave
Inside the Packet receiver and analyser is the patent MONI PacketWave Real-Time Microburst Analysis Pipeline:
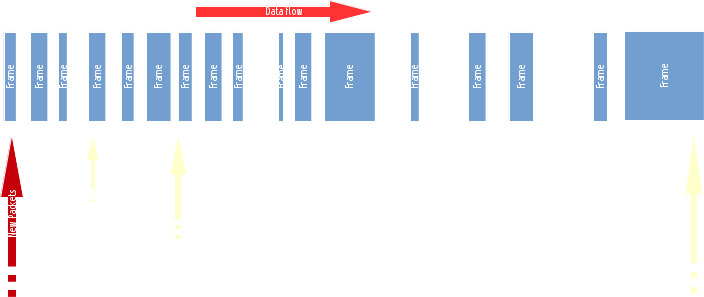
This shows how the unique MONI PacketWave real-time microburst analysis algorithm works.
Packets ("frames") are saved as soon as they arrive and their sizes and arrival times are saved in the PacketWave pipeline.
In the diagram you see how the packet sizes in the pipeline are totalled from the newest packet up to ones seen after some fixed time period has passed.
These fixed time periods are known as microburst windows.
The diagram shows the 1 millisecond, 2 milliseconds and 5 milliseconds microburst windows, but the full pipeline
is 1, 2, 5, 10, 20, 50, 100, 200, 500 and 1,000 milliseconds (= 1 second).
It does this each time a new packet arrives, adding the new packet size and subtracting the older ones
now more than the fixed microburst window end time since it saw them.
All 10 microburst windows are updated concurrently with each new packet retaining these running size totals for all of them.
Competitors products tend to use "time bins": segmented times over which the total is calculated.
The full time is divided (for example 1 minute is divided into 60,000 millisecond time bins) and the data size in each bin is calculated.
This is not accurate as there may be a spike which is on the boundary of 2 bins so gets missed.
These missing spikes happen more often as the window time gets shorter making the accuracy worse for smaller times.
MONI PacketWave uses real-time totals updated for each new packet, so is fast and 100% accurate.
The peak total for the microburst windows are also tracked real-time for each new packet arriving, called the microburst peak.
Freshly calculated window totals are compared to the stored peak for each of the 10 microburst windows and updated if it exceeds it.
Every so often the current microburst peaks are stored in the database and reset.
This way you have a record of the microburst peak values over time and can see the shape of the traffic at microburst level.
It is these peak values from the analysis database you see in this shot of a real PacketWave microburst graph.
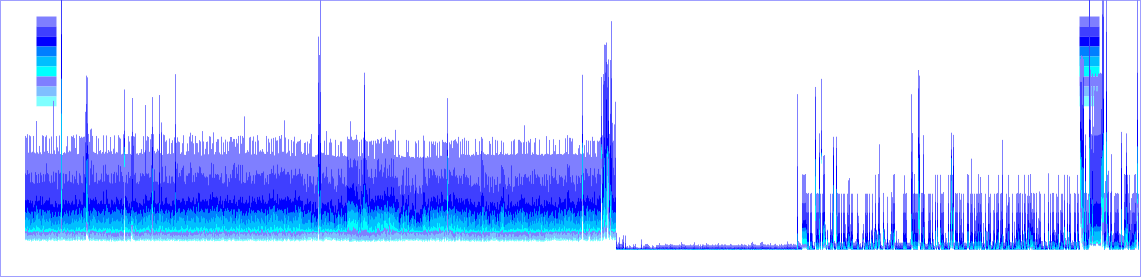
Each single thin vertical line has all 10 microburst peak values for that minute.
You can see the values are coloured down from blue (for 1 millisecond) to white (for 1 second) at the bottom.
This shows you in amazing detail what happened to the traffic in the last 18 hours, and this is only available from MONI.
Here (above) you can see looking at the 1 second peaks in white that the traffic didn't go above 10Mpbs,
however instantaneous peaks are over 150Mbps.
Adjusting the graph vertically you can see (below) there are peaks almost to 350Mbps (at around 4pm) ...
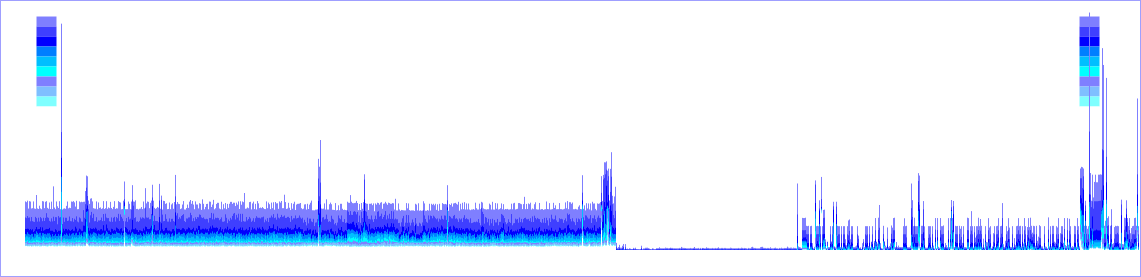
... which will definitely result in loss over the users 50Mbps carrier circuit!
From here you can download the PCAP files and discover exactly what happened around 4pm since this MONI node also
captured every single packet at that time for deep inspection.
Competitors products tend to show average data rates over the time periods.
Also they generally do not capture packets without specifically being configured in advance and even then it will be for short periods.
All MONI nodes come preconfigured to capture every packet they see and save them for as long as they can, sometimes months and even years.
MONI PacketWave shows the peak values throughout so you know warts-n-all what happened on the wire in one all-you-can-eat view.